

CLOUD BASED BILLING AND MONITORING FOR LARGE PLANTS OR DATA CENTRES
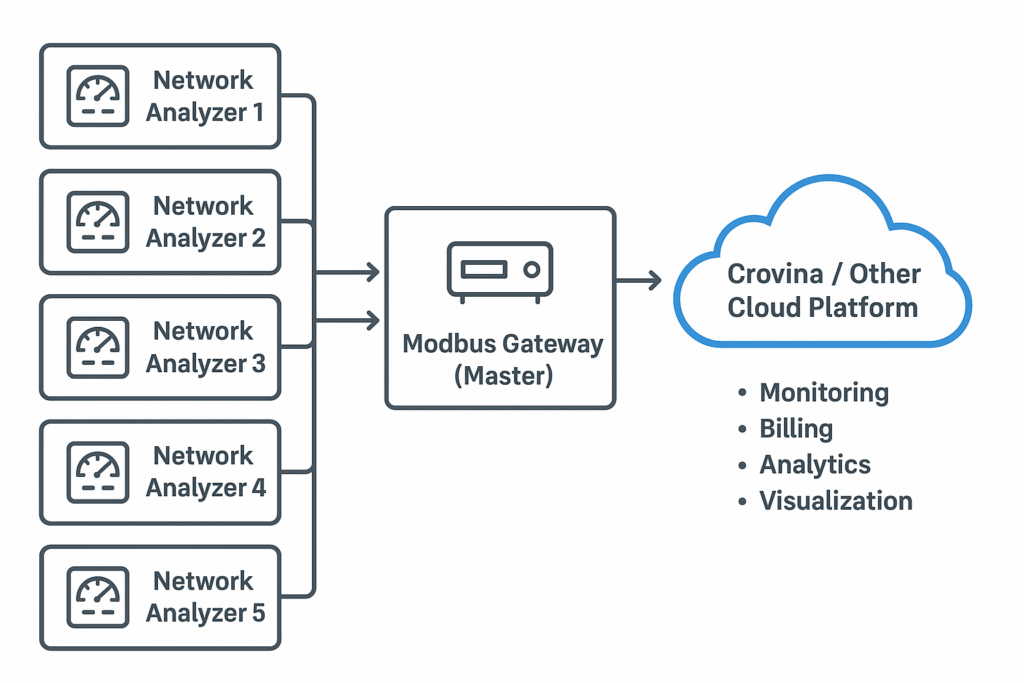
Brief Description of the Architecture
The diagram represents a data acquisition and monitoring architecture where multiple network analyzers communicate with a Modbus Gateway (Master), which in turn sends the data to a cloud platform (like Crovina). The cloud platform handles data visualization, analysis, billing, and plant supervision, providing an accessible, centralized view of the electrical or operational parameters measured in the field.
System Overview
- Field Layer:
32 network analyzers (for example, Schneider, Carlo Gavazzi, or Siemens) installed on various panels or substations. - Communication Layer:
All analyzers are connected via RS-485 Modbus RTU to a Modbus Gateway acting as the Master. - Cloud Layer:
The gateway sends data to the cloud platform (Crovina) using MQTT or HTTP REST API protocols for visualization and analytics.
Addressing and Communication Setup
Each network analyzer must have a unique Modbus slave address (1–32).
Example setup:
| Device | Modbus Address | Description |
|---|---|---|
| Network Analyzer 1 | 1 | Main incomer meter |
| Network Analyzer 2 | 2 | Feeder A |
| Network Analyzer 3 | 3 | Feeder B |
| … | … | … |
| Network Analyzer 32 | 32 | Solar inverter feed |
Communication parameters (typical):
- Baud rate:
9600 bps - Parity:
Even - Stop bits:
1 - Data bits:
8 - Protocol:
Modbus RTU
The gateway polls all analyzers cyclically using these parameters.
Gateway Configuration (Master)
- Connect to the Gateway’s Web Interface or Configuration Tool.
- Create a Modbus Master Channel:
- Select RS-485 port.
- Set communication parameters to match analyzers.
- Add 32 Slave Devices:
- Assign addresses 1–32.
- Map variables for each (see below).
- Define Variable Mapping:
- Each analyzer has 10 variables (e.g., Voltage, Current, Power, PF, Frequency, Energy, etc.).
- Map Modbus register addresses to readable tags.
- Example for Analyzer 1:
| Variable | Register | Scale | Unit |
|---|
| Voltage L1 | 40001 | 0.1 | V |
| Current L1 | 40003 | 0.01 | A |
| Power | 40005 | 0.1 | kW |
| Power Factor | 40007 | 0.001 | — |
| Frequency | 40009 | 0.01 | Hz |
| Energy | 40011 | 1 | kWh |
| … | … | … | … |
Cloud Integration
Once variables are defined, configure the gateway to push data to the cloud:
- Protocol: MQTT or HTTPS
- Update Interval: e.g., every 60 seconds
- Topic/Tag structure (for MQTT):
/plantA/analyzer01/voltage
/plantA/analyzer01/current
…
/plantA/analyzer32/power
Security: Use TLS encryption, and authentication tokens from the cloud provider.
Example of Data in the Cloud
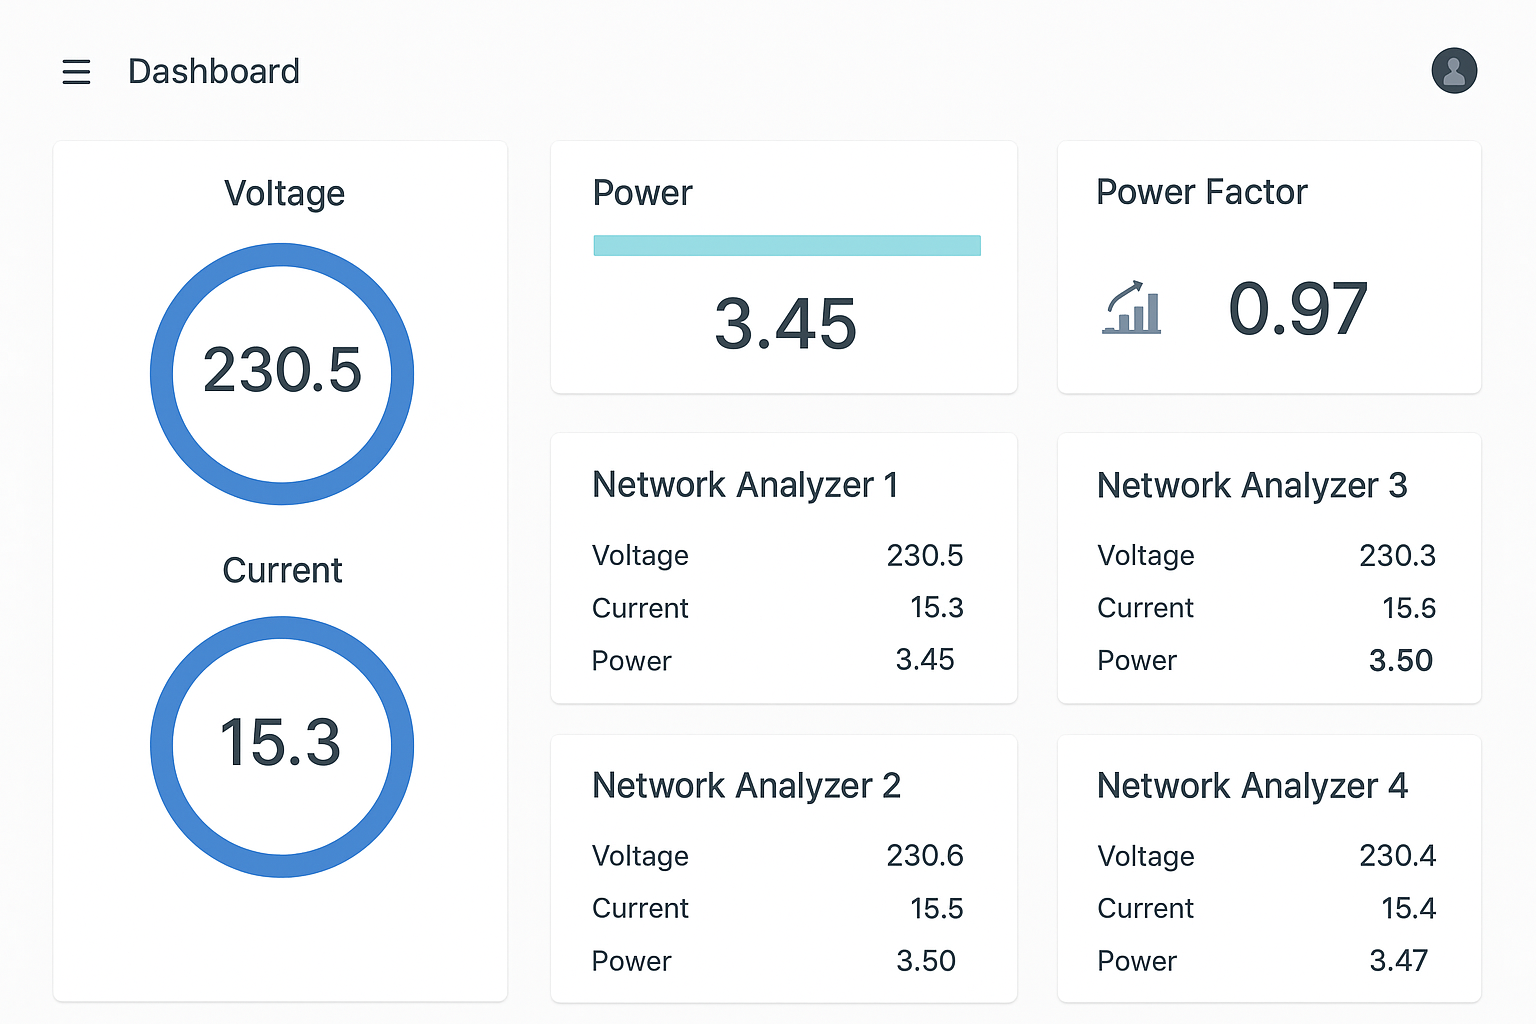
Once data is received, it appears as time-series variables.
Example JSON payload (from one polling cycle):
{
“timestamp”: “2025-10-21T09:15:00Z”,
“device_id”: “Analyzer_05”,
“variables”: {
“voltage_L1”: 230.5,
“current_L1”: 15.3,
“active_power”: 3.45,
“power_factor”: 0.97,
“frequency”: 50.0,
“energy_total”: 12560.2,
“demand_kw”: 3.80,
“thd_v”: 1.5,
“thd_i”: 3.2,
“temperature”: 28.5
}
}
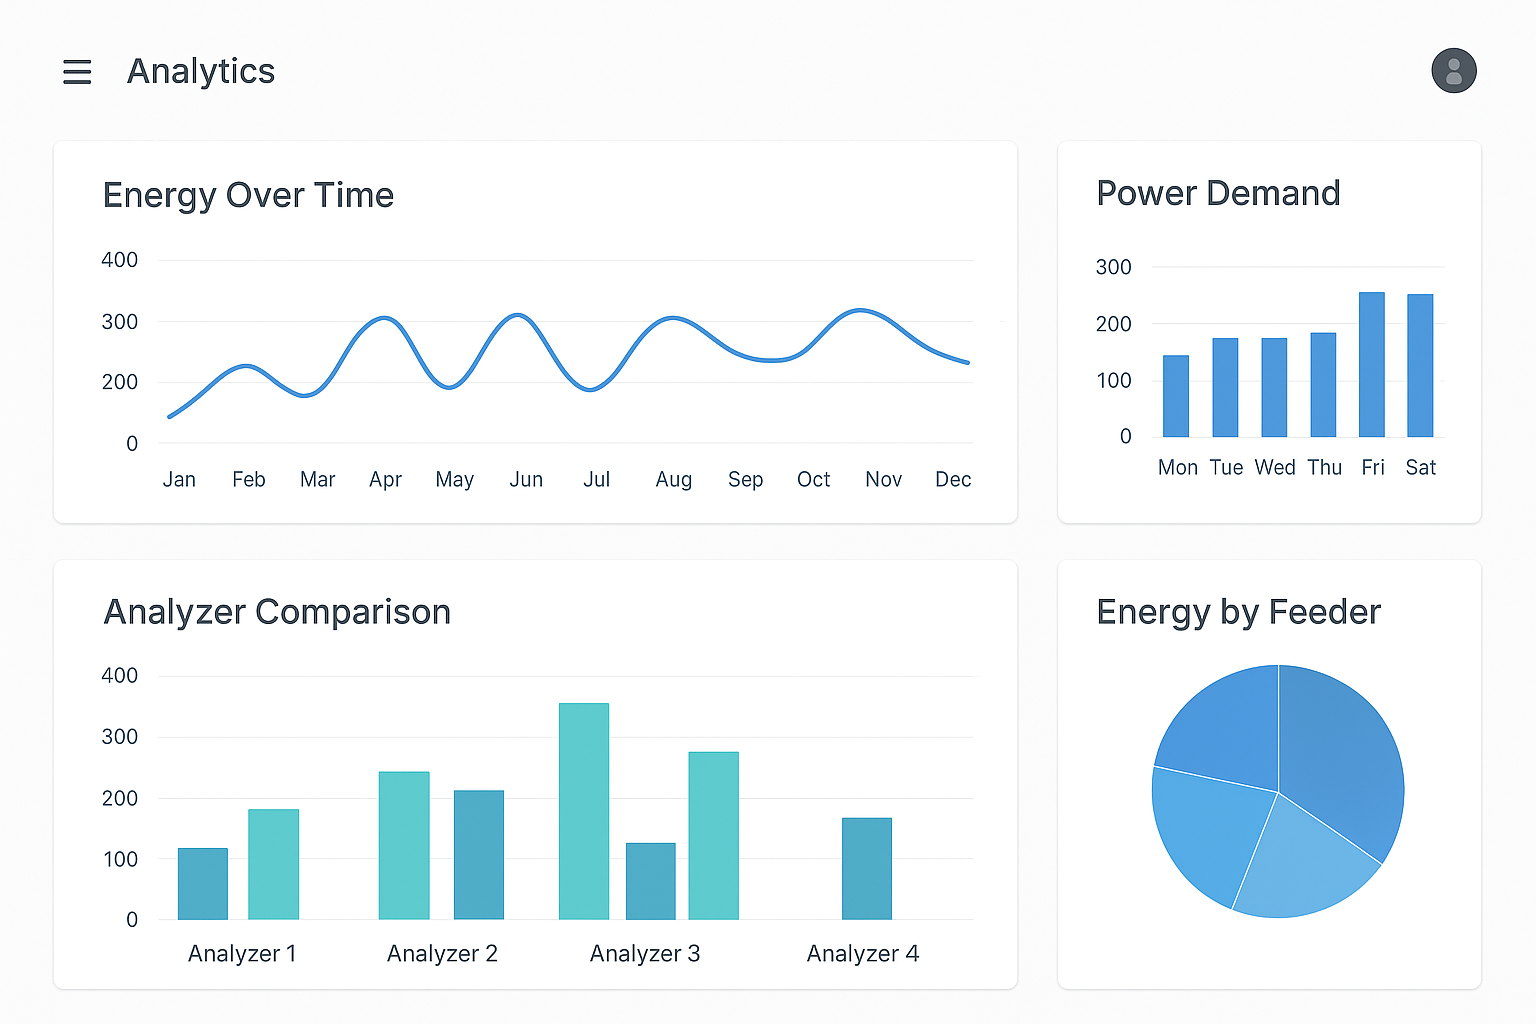
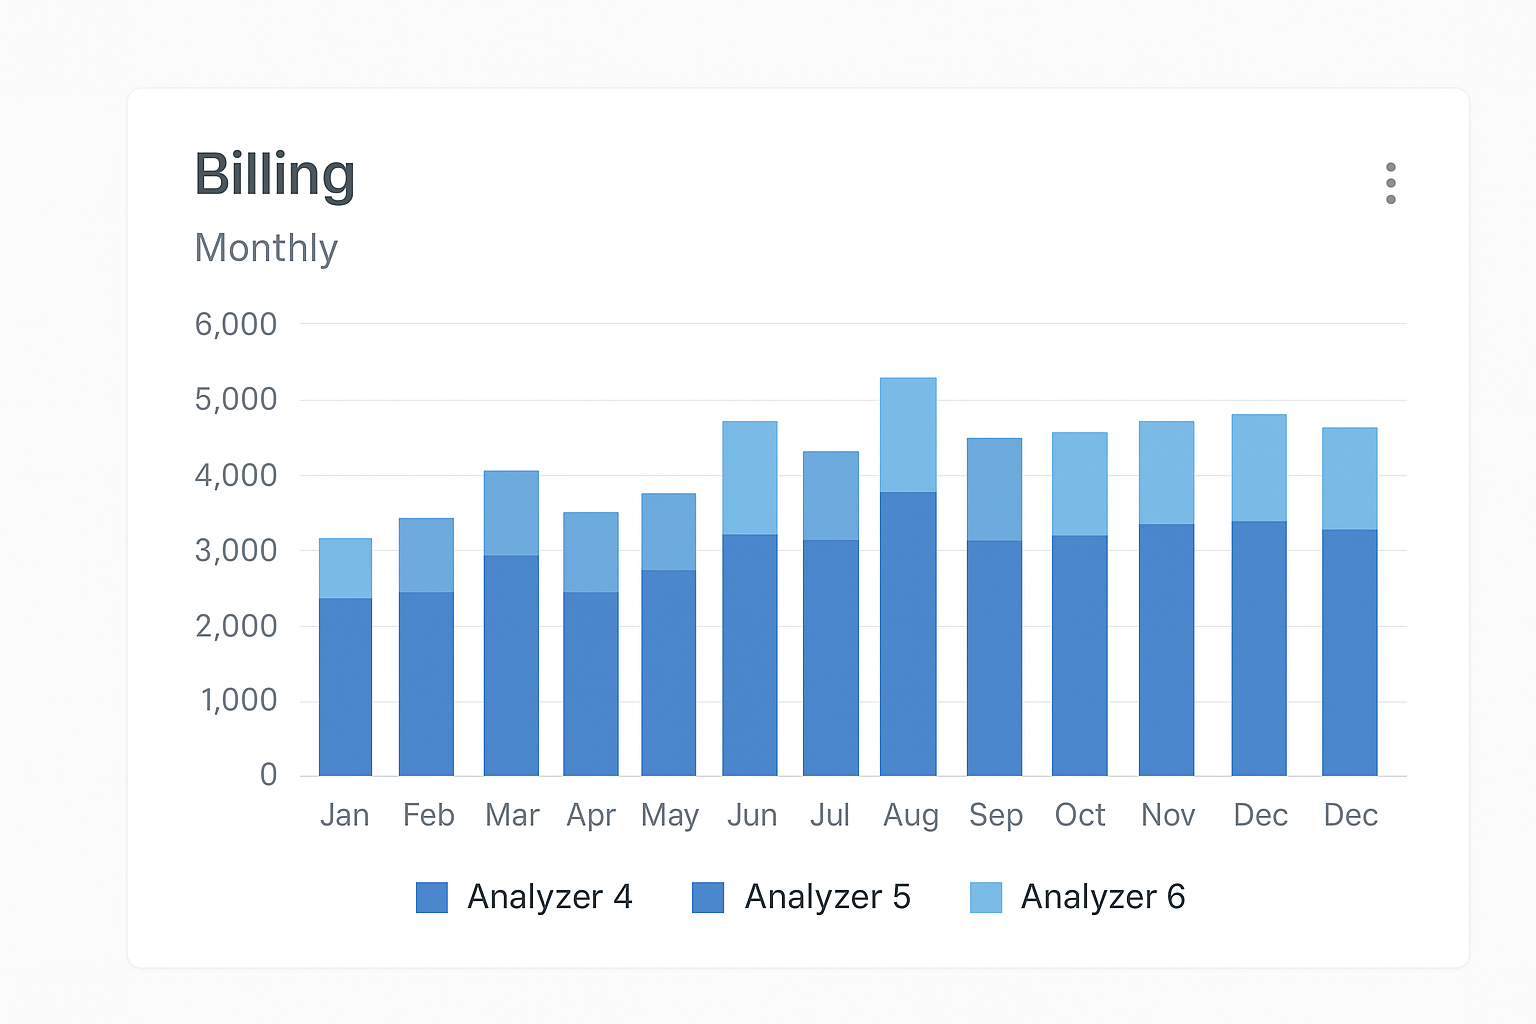
On the cloud dashboard, you could visualize:
- Real-time charts for each variable.
- Aggregated reports per day/week/month.
- Billing summaries (based on kWh × tariff).
- Alerts for thresholds (e.g., low PF or high demand).
TEMPERATURE MONITORING OVER CLOUD VIA PLC
Application overview — purpose & scope
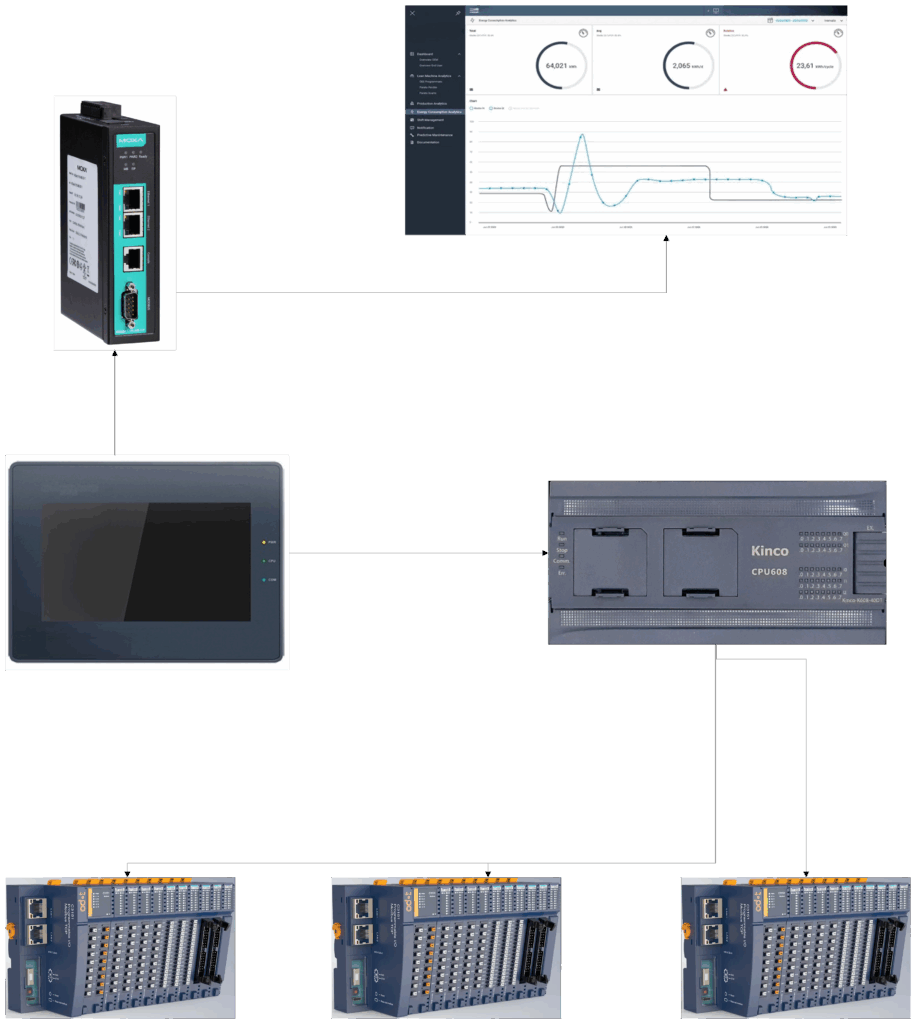
This application was created to supervise and control temperatures in a plant where there are three power busbar lines: one line rated 6300 A and two lines rated 2000 A each. The goal is to continuously monitor temperatures at the busbar joints and elements, trigger local alarms via a Kinco PLC when temperatures exceed the safety threshold, and also monitor and interact via the cloud for trending, logging and remote alerts.
Short system recap
- Total PT100 sensors (joints): 26 (8 on 6300 A busbar + 9 + 9).
- Local box hardware (per box): 1 × CN-8011 adapter + 3 × CT-3713 (3×3 channels = 9 channels / box). You will need 3 boxes (9 + 9 + 8).
- RS-485 Modbus RTU bus connects all CN-8011 nodes to the Kinco K608 PLC KB6-2COM port. HMI is on the second KB6-2COM port. A gateway polls PLC or nodes to push to cloud.
Important notes about register mapping and tools
- ODOT CN-8011 is an adapter that exposes the attached IO modules (CT-3713) as Modbus registers; the exact addresses depend on the module combination and the adapter configuration. The CN-8011 manual / IO-Config utility will show the exact register offsets after you assemble modules. By convention the adapter supports Modbus function codes 03/04, so you can read either Holding or Input registers as configured.
- CT-3713 is a 3-channel RTD module (15-bit ADC) and exposes temperature values via the internal bus to the CN-8011. The CT-3713 manual confirms 3-ch RTD inputs and isolated internal bus.
- Because vendor mapping can vary, I provide a clear example mapping you can adopt immediately; it uses standard Modbus conventions and is compatible with the CN-8011 behaviour described in its manual. If you prefer, run IO-Config and then drop the exact maps into the PLC; I explain where to change addresses.
Modbus addressing convention used in the example
- Each CN-8011 is a separate Modbus slave device on RS-485. Use unique slave IDs (we’ll use 11, 12, 13 in the examples).
- Each CN-8011 will expose its CT-3713 channel temperatures as Input Registers (Modbus FC04) or Holding Registers (FC03) — whichever you choose; I use Input Registers (FC04) in the tables below for clarity.
- Register values are 16-bit signed integers representing temperature in tenths of °C (scale factor 0.1°C). Example: register value
725= 72.5 °C. This is a common and compact choice; you can change scaling if your CT-3713/adapter uses different scaling (check IO-Config). - Diagnostic / module status registers are provided per box (one word per box) to indicate module errors, channels present, and communication health. CN-8011 exposes module state information — read it during commissioning.
Example Modbus mapping tables (ready to copy into PLC tags)
Important: addresses below are per slave (the same register offsets apply on each CN-8011 slave). The PLC identifies the box by Modbus slave ID (11, 12, 13).
Box (CN-8011) slave assignment
| Box | Location / Notes | Modbus Slave ID |
|---|---|---|
| A | 6300 A busbar joints (8 points) | 11 |
| B | 2000 A line 1 (9 points) | 12 |
| C | 2000 A line 2 (9 points) | 13 |
Per-box: Input registers (FC04) — PT100 channels (temperature)
| Channel | Logical tag name | Register (Input) | Data type | Scaling | Units | Example value |
|---|---|---|---|---|---|---|
| CH1 | BoxX_Temp_01 | 30001 (0x0000) | INT16 | ×0.1 | °C | 725 -> 72.5 °C |
| CH2 | BoxX_Temp_02 | 30002 (0x0001) | INT16 | ×0.1 | °C | |
| CH3 | BoxX_Temp_03 | 30003 (0x0002) | INT16 | ×0.1 | °C | |
| CH4 | BoxX_Temp_04 | 30004 (0x0003) | INT16 | ×0.1 | °C | |
| CH5 | BoxX_Temp_05 | 30005 (0x0004) | INT16 | ×0.1 | °C | |
| CH6 | BoxX_Temp_06 | 30006 (0x0005) | INT16 | ×0.1 | °C | |
| CH7 | BoxX_Temp_07 | 30007 (0x0006) | INT16 | ×0.1 | °C | |
| CH8 | BoxX_Temp_08 | 30008 (0x0007) | INT16 | ×0.1 | °C | |
| CH9 | BoxX_Temp_09 | 30009 (0x0008) | INT16 | ×0.1 | °C |
How to interpret “BoxX”: replace BoxX with BoxA (slave 11), BoxB (12) or BoxC (13). So BoxB_Temp_03 corresponds to slave 12, register 30003 (as an example).
Note: Box A will only use CH1..CH8 (30001..30008). Box B and C will use CH1..CH9.
Per-box: Diagnostics & status registers (example)
| Register | Desc. (per box) | Register (Input) | Data type | Use |
|---|---|---|---|---|
| 30020 | Module status / error bits | 30020 (0x0013) | UINT16 | Bit-mapped: bit0=module_ok, bit1=module_fault, bit2=comm_err, bits[7..4]=channel_fault_mask |
| 30021 | Firmware / module count | 30021 (0x0014) | UINT16 | lower byte = number of attached IO modules; high byte = fw version code |
| 30022 | Temp sensor health bitmap | 30022 (0x0015) | UINT16 | each bit = channel sensor fault (1 = fault) |
These diagnostic registers are an example structure. The CN-8011 manual indicates the adapter exposes module state; the exact addresses will appear in IO-Config after you assemble the hardware. Use IO-Config to get the definitive map, then align PLC tags.
Example global tag naming table (all 26 sensors)
Here’s a ready list you can paste into a tag import for the PLC/HMI (showing TagName = SlaveID:Register):
| Tag name | Slave ID | Register | Meaning |
|---|---|---|---|
| A_T1_TEMP | 11 | 30001 | Box A channel 1 (Busbar joint 1) |
| A_T2_TEMP | 11 | 30002 | Box A channel 2 (Busbar joint 2) |
| … | 11 | 30003..30008 | Box A channels 3..8 (joint 3..8) |
| B_T1_TEMP | 12 | 30001 | Box B channel 1 (Line2 joint 1) |
| B_T2_TEMP | 12 | 30002 | … |
| … | 12 | 30001..30009 | Box B channels 1..9 |
| C_T1_TEMP | 13 | 30001..30009 | Box C channels 1..9 |
(Full 26 tags are implied — Box A has 8 tags, Boxes B and C each 9.)
Example Modbus RTU read frame
Read Box A channel 1 (slave 11), Input Register 30001 (register offset 0) — FC04 read 1 register:
- Modbus RTU frame (hex):
0B 04 00 00 00 01 CRC16_lo CRC16_hi0B= slave 11 decimal (0x0B)04= function code 04 (Read Input Registers)00 00= start address 0 (i.e. 30001)00 01= quantity 1 register
Response (example returning decimal 725 → 72.5 °C):0B 04 02 02 D5 CRC16_lo CRC16_hi
02= two data bytes follow,02 D5= 0x02D5 = 725 decimal.
(If you use FC03 and holding registers, function code becomes 03 instead of 04.) Use your PLC Modbus client block to do multi-register bulk reads for efficiency.
Polling & performance recommendations
- Polling strategy: read per box in a single multi-register read (e.g., start 30001, quantity 9) rather than reading each channel separately. This reduces RS-485 overhead and improves cycle time.
- Example: to read all 9 channels from Box B in one request, use FC04 start 0x0000 qty 0x0009.
- Suggested real-time polling rate for temperature detection on busbar joints: 1–5 s for local alarming. For cloud trending a 30–60 s aggregated push is fine. CT-3713 conversion times are short (15–20 ms per channel ADC); the bus & PLC will be the main limiter.
PLC control & alarm implementation — structured, production-ready
Key parameters (configurable tags)
TEMP_THRESHOLD_ALARM := 70.0°CTEMP_HYSTERESIS := 2.0°C (reset when below 68.0 °C)POLL_INTERVAL := 2 s(read all boxes every 2 s)ALARM_ACK[1..26](boolean per sensor)ALARM_ACTIVE[1..26](latched)ALARM_TIME[1..26](timestamp when alarm set)SENSOR_HEALTH[1..26](from box diagnostic bits)
High-level flow (pseudocode / Structured Text)
// Polling loop: run every POLL_INTERVAL
FOR each box IN [11,12,13] DO
  ReadRegisters(box, start=30001, qty=9, into boxTemps[])
  FOR i := 1 TO 9 DO
    globalTagIndex := MapBoxChannelToGlobalIndex(box, i)
    IF ChannelExists(globalTagIndex) THEN
       Temp := boxTemps[i] * 0.1;  // apply scaling
       SENSOR_TEMP[globalTagIndex] := Temp;
       // Health check from diagnostics (read 30020)
       SENSOR_HEALTH[globalTagIndex] := ReadSensorHealth(box, i);
       // Alarm logic with hysteresis and latch
       IF (SENSOR_HEALTH[globalTagIndex] = FALSE) THEN
          FLAG_SENSOR_FAULT[globalTagIndex] := TRUE;
       END_IF
       IF (Temp >= TEMP_THRESHOLD_ALARM) THEN
          ALARM_ACTIVE[globalTagIndex] := TRUE;
          IF (ALARM_TIME[globalTagIndex] = 0) THEN
              ALARM_TIME[globalTagIndex] := NOW();
          END_IF
       ELSIF (Temp <= (TEMP_THRESHOLD_ALARM - TEMP_HYSTERESIS)) THEN
          // auto-reset allowed? choose policy:
          IF (MANUAL_ACK_REQUIRED = FALSE) THEN
             ALARM_ACTIVE[globalTagIndex] := FALSE;
             ALARM_TIME[globalTagIndex] := 0;
          END_IF
       END_IF
    END_IF
  END_FOR
END_FOR

// Overall alarm
ANY_ALARM := OR(ALARM_ACTIVE[*]);

// HMI / Relay actions
IF ANY_ALARM THEN
  HMI.DisplayAlarmBanner := TRUE; // HMI code will flash banner
  // Set relay / hardwired alarm output if configured
  ALARM_OUTPUT := TRUE;
ELSE
  HMI.DisplayAlarmBanner := FALSE;
  ALARM_OUTPUT := FALSE;
END_IF
Alarm acknowledgement handling
- When operator presses ACK on HMI:
- For each
ALARM_ACTIVEthat isTRUE: setALARM_ACK[tag] := TRUEand push an event record{tag, temp, alarm_time, ack_time, operator}into PLC circular log. - HMI continues to show alarm until
ALARM_ACTIVEis FALSE (i.e., the temperature goes below reset threshold). The ack does not clear the alarm condition, only acknowledges it in the log/UI.
- For each
Logging & history
- Maintain a circular buffer of alarm events in PLC memory: store
tag,temp,time,event_type(alarm_on / ack / reset),operator. Export logs via gateway periodically or on demand.
HMI behavior & recommended screens
- Overview screen — shows three line icons (6300A, 2000A #1, 2000A #2) with colored LED (green/yellow/red) based on highest temp on that line. Clicking open line detail.
- Line detail — table of joints: ID, current °C, min/max (24h), status (OK/ALARM/FAULT). When a joint is in alarm
rowflashes (alternating background color) and showsACKbutton inline. - Alarm page — list of active alarms with timestamp, sensor ID, temp, health, and large
ACKbutton. After acknowledging, it is marked acknowledged but still shows as active until condition clears. - Trends — show temp vs time chart for selected sensor (last 24h). On alarm you can have a second image/overlay where the alarm area is shaded in red (HMI chart overlay). Kinco GL070 supports trend widgets and popups.
Cloud integration & alarm event policy
- Gateway polls PLC or CN-8011 (whichever policy you prefer). For cloud trends push 1 sample per minute. For alarms push immediate messages (MQTT topic
/plantX/alarms) with JSON payload:
{
  "tag":"A_T3_TEMP",
  "temp":72.5,
  "time":"2025-10-21T14:32:10Z",
  "severity":"HIGH",
  "ack":false
}
- Cloud dashboard: show global trend (all sensors) aggregated, color rows in alarm, and show push notifications / SMS / email as necessary. (Example Elettroexport architectures use gateway → MQTT/REST to cloud; follow TLS and QoS best practices.)
Commissioning / testing plan
- Before connecting PT100 wires, measure wiring continuity and short/open tests.
- Assemble boxes: CN-8011 + 3 × CT-3713 each; power up internal bus and confirm adapter recognizes modules (use IO-Config). Confirm slave IDs are set (11,12,13).
- Use a Modbus diagnostic tool or PLC read blocks to verify register map: read 30001..30009 on slave 11 and check sensible values (ambient temp) for each channel. If values look scaled wrong, check CT-3713 scaling/IO-Config.
- Calibrate each PT100 vs reference thermometer (ice bath, ambient, warm source). Adjust scaling if needed.
- Test alarm by forcing a channel value (software override or calibrated heat source) above 70°C and verify PLC/HMI/gateway alarm behavior and logs. Test ack and reset logic.
Troubleshooting tips & gotchas
- Scaling mismatch: If IO-Config or CT-3713 shows a different scaling (e.g., ×0.01), change PLC multiplier accordingly. Always validate with a physical reference.
- RS-485 wiring: use daisy-chain topology, single termination 120 Ω at each physical end, keep shield grounded at one point only. Avoid stubs > 0.3 m.
- Sensor wiring: use 4-wire shielded cable when distances are long (>2–3 m) to avoid lead resistance affecting accuracy; CT-3713 supports 2/3-wire but 4-wire gives best accuracy.
- Module recognition: CN-8011’s IO mapping is dynamic—always verify the adapter’s map after changing module population; then update PLC addresses if needed. Use vendor IO-Config to export the final map.
Appendix — quick reference
Tag template (CSV row format example)
TagName,SlaveID,Function,Register,Scaling,Units,DescA_T1_TEMP,11,FC04,30001,0.1,°C,BoxA channel1 (Busbar joint 1)B_T9_TEMP,12,FC04,30009,0.1,°C,BoxB channel9C_T5_TEMP,13,FC04,30005,0.1,°C,BoxC channel5BoxA_STATUS,11,FC04,30020,1,bitmask,Adapter/module status
NOTE : OUR EXAPLES ARE AI GENERATED KEEPING IN MIND TO CREATE CONTENTS VERY CLOSE TO THE FIELD REALITY.